Building an Early Detection System
Implement routine health checks, uptime monitors, and log analysis to catch critical failures before they impact your users.

Overview: Troubleshooting doesn’t begin when something breaks—it begins with early detection. This lesson teaches how to proactively monitor WordPress health using built-in tools, external services, and recurring audits. The goal is to catch issues before they escalate into downtime, performance degradation, or security incidents.
Why Proactive Troubleshooting Matters
Reactive fixes are costly. They interrupt workflows, damage SEO, and erode user trust. Proactive troubleshooting reduces emergencies by surfacing weak points early—whether it’s a failing scheduled task, a slow-loading page, or a brute force attack in progress.
Step 1: Use WordPress Site Health

- Navigate to Tools → Site Health
- Review the Status tab for critical and recommended improvements
- Use the Info tab to inspect server configuration, database settings, constants, and filesystem permissions
- Common alerts include: Outdated PHP version, Missing HTTPS, Failed scheduled events, REST API or loopback errors, and Caching recommendations
Best Practice: Review Site Health weekly. Address “Critical” items immediately.
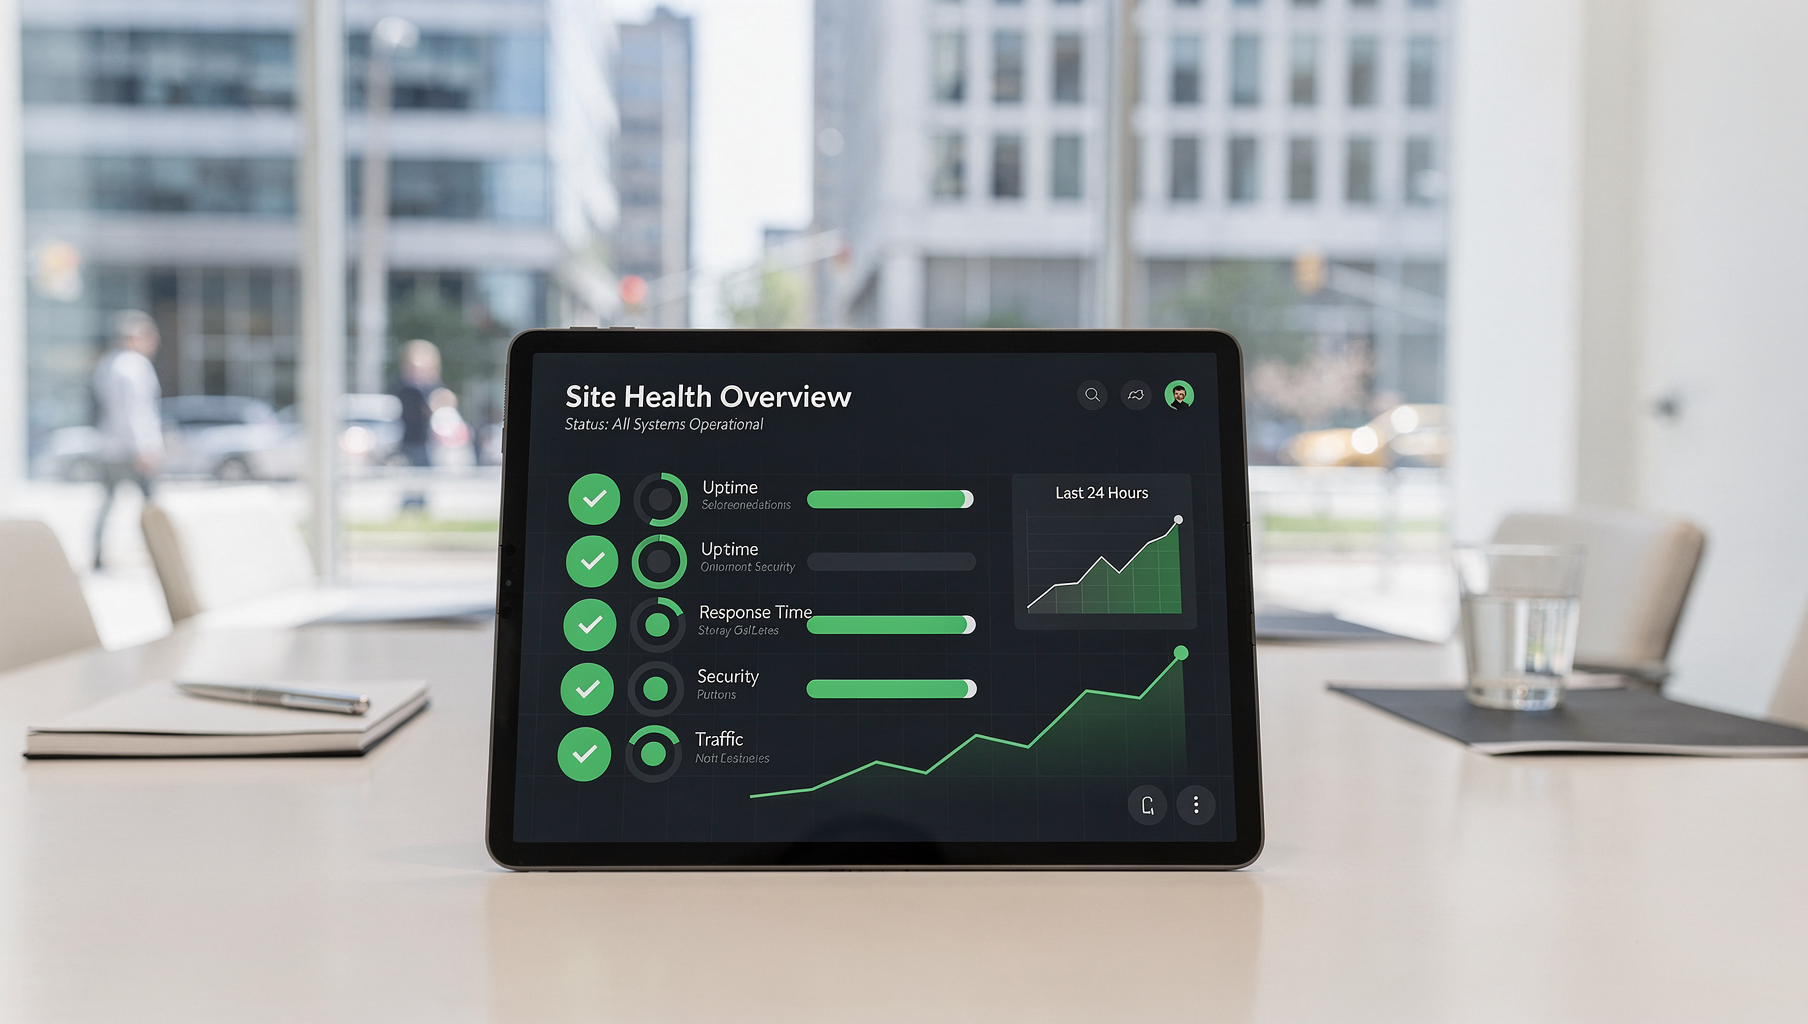
Step 2: Monitor Uptime and Performance

- Use external monitors to detect outages and slowdowns in real time
- Recommended monitoring tools: Sucuri Website Monitoring, Pingdom, and UptimeRobot
- Pair uptime checks with performance monitoring: Google PageSpeed Insights, GTmetrix, and WebPageTest
Best Practice: Set alerts for downtime and track performance trends over time.
Step 3: Review Logs for Early Warnings

- debug.log: Enabled via WP_DEBUG_LOG, this captures PHP warnings, notices, and fatal errors (located in /wp-content/debug.log)
- Server logs: Reveal 403/500 spikes, memory errors, and suspicious requests
- Firewall logs: Show blocked IPs, brute force attempts, and repeated attacks
Best Practice: Review logs weekly or after any unusual behavior.
Step 4: Monitor Security and Firewall Alerts

- Web Application Firewalls (WAFs) like Sucuri log every blocked attempt
- Reviewing these logs helps you: Understand attack patterns, identify persistent threats, and fine-tune firewall rules to reduce false positives
Best Practice: Set up email alerts and review WAF logs monthly.
Step 5: Run Regular Audits

| Audit Type | Frequency | Purpose |
|---|---|---|
| Plugin/theme review | Monthly | Remove unused, update active |
| Hosting stack audit | Quarterly | Check PHP, MySQL, SSL, and server config |
| Full site health review | Annually | Validate backups, security, performance |
Best Practice: Document audit results and remediation actions.
Quick Recap
- Site Health surfaces internal WordPress issues
- Uptime and performance monitors detect outages and slowdowns
- Logs reveal early signs of failure or attack
- Firewall alerts show real-time threat activity
- Recurring audits prevent silent degradation


